Project-2
E- Commerce Sales Analysis || Microsoft Excel

Engaged in a comprehensive analysis of an e-commerce website's data, employing data cleaning, transformation, and visualization techniques to derive valuable insights for strategic decision-making.
Objective
Conduct a comprehensive analysis of an e-commerce website's data, emphasizing data cleaning, transformation, and visualization techniques. The goal is to derive actionable insights for strategic decision-making.
Data Cleaning:
Conducted a thorough analysis of all fields, identifying columns conducive to storytelling.
Addressed null and inconsistent values to ensure data integrity.
Data Transformation:
Standardized units, providing clarity, especially in currency columns.
Introduced a new column for month extraction from the date, facilitating monthly sales and revenue analysis.
Data Visualization:
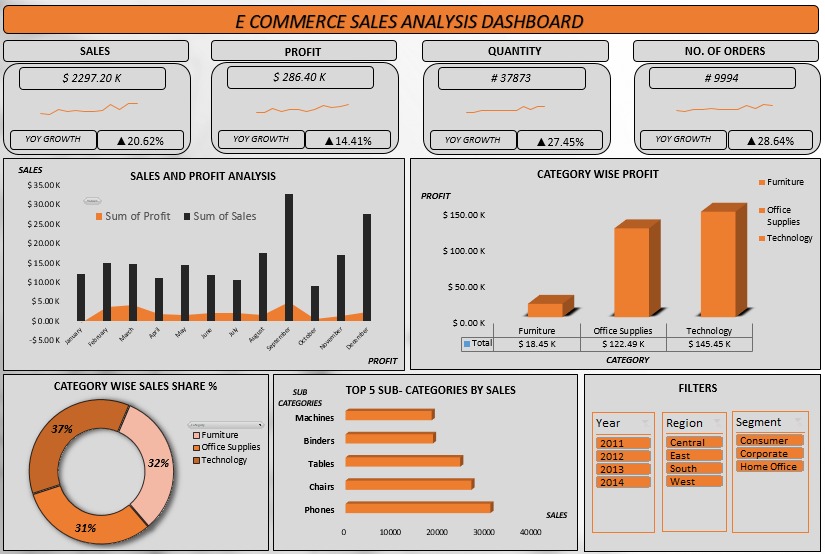
Sales vs Profit Monthly Comparison:
Visualized the monthly comparison of sales and profits, offering insights into financial performance trends.
Category-wise Profit Analysis:
Presented a breakdown of profits based on product categories, aiding in identifying lucrative areas.
Category-wise Sales Share Percentage:
Illustrated the percentage share of sales across different product categories.
Top 5 Selling Sub-categories:
Highlighted the top-performing sub-categories, providing a quick overview of high-demand items.
Key Performance Index (KPI) Charts:
Developed KPIs for Sales, Profit, Quantity, and the number of orders, offering a holistic performance snapshot.
Slicer Integration:
Employed slicers linked to charts, allowing dynamic filtering by Year, Region, and Segment for deeper exploration.
Conclusion:
Through a meticulous analysis of the e-commerce data, I've uncovered valuable insights that can drive strategic decision-making. By delving into the charts and values, it's evident that focusing on high-performing regions and strategically targeting peak months can significantly boost sales revenues.